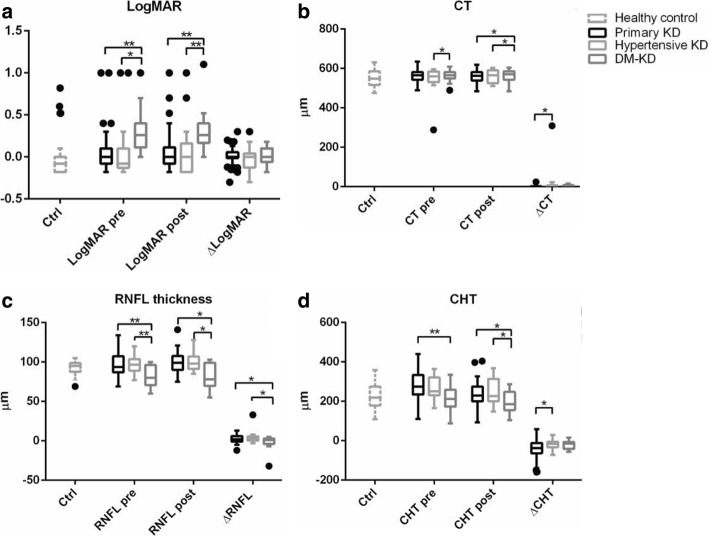
Fig. 2.
Comparison of the logMAR of the BCVA, central corneal thickness (CT), RNFL thickness and choroid thickness (CHT) among the primary KD, hypertensive KD, and DM-KD subgroups. a The logMAR of the BCVA of the DM-KD subgroup was significantly higher than that of the primary KD subgroup and the hypertensive KD subgroup before and after HD. b The CT of the DM-KD subgroup was significantly higher before and after HD. c The average RNFL thickness of the DM-KD subgroup was significantly lower than that of the other 2 subgroups both before and after HD, and a lower change of RNFL thickness of the DM-KD was found compared to the other 2 subgroups. The 3 bars are from left to right: the primary kidney disease (KD) subgroup (n = 27), the hypertensive KD subgroup (n = 9), the diabetic mellitus KD (DM-KD) subgroup (n = 6). d The CHT in the DM-KD subgroup was lower than that of the other 2 subgroups before and after HD. Δ value (change of value) was defined as the value after HD minus the value before HD. *: P < 0.05; **: P < 0.01

