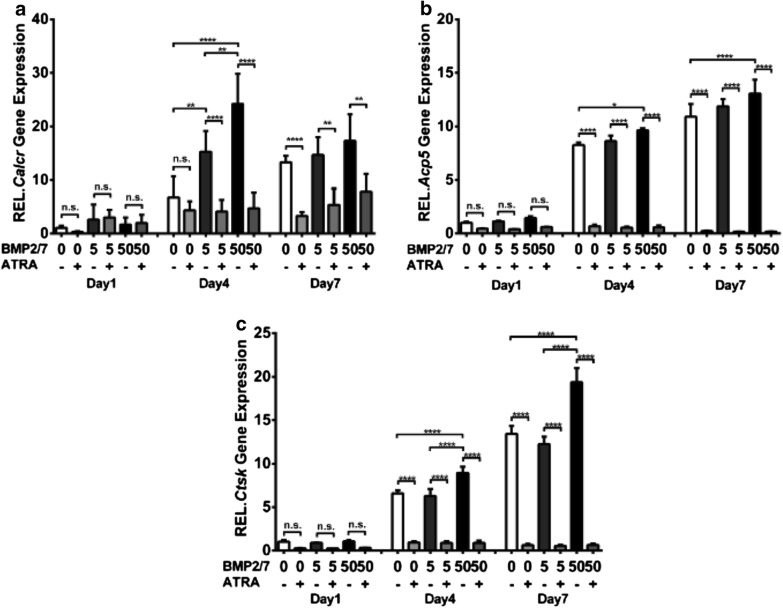
Fig. 2.
BMP2/7 (5 or 50 ng/ml) ± ATRA (1 µM) modulated osteoclast marker gene expression in RAW264.7 cell cultures. a Calcr, b Acp5, and c Ctsk expression in RAW264.7 cells at day 1, 4 and 7. Values are mean ± SD, from three independent experiments. Significant effect of the treatment *p < 0.05, **p < 0.01, ***p < 0.001, ****p < 0.0001, n.s. no significant difference

