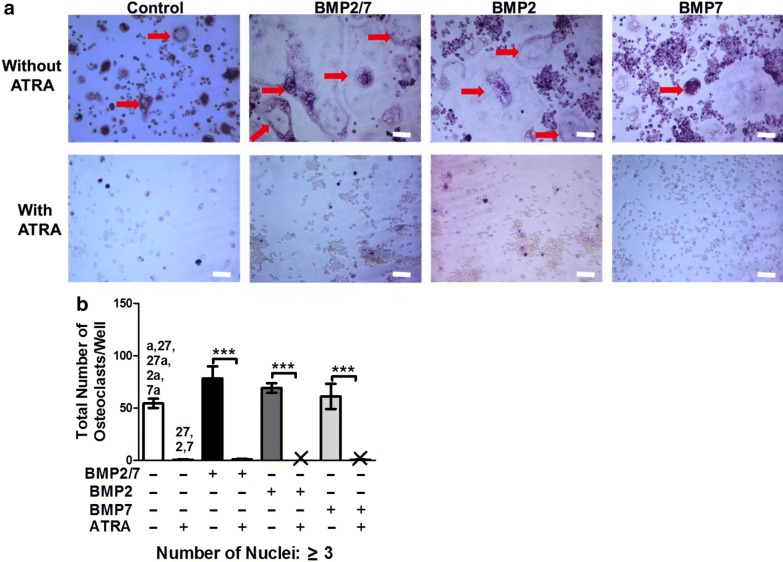
Fig. 5.
BMP2/7 (5 or 50 ng/ml) ± ATRA (1 µM) modulated osteoclastogenesis in RAW264.7 cell cultures. a Representative microscopic image of osteoclast formed in different groups: control, 5 ng/ml BMP2/7, 50 ng/ml BMP2/7, and 50 ng/ml BMP2/7 + 1 µM ATRA. Red arrow indicates the TRACP-positive multinucleated osteoclast. b Semi-quantitative analysis osteoclast numbers. X indicates nil. All data are presented as mean ± SD, from three independent experiments. Significant effect of the treatment, ****p < 0.0001, Significant difference also existed compared to the indicated group (p < 0.05): a no BMP2/7 + ATRA, 27 BMP2/7 + no ATRA, 27a BMP2/7 + ATRA, 2 BMP2 + no ATRA, 2a BMP2 + ATRA, 7 BMP7 + no ATRA, 7a BMP7 + ATRA

