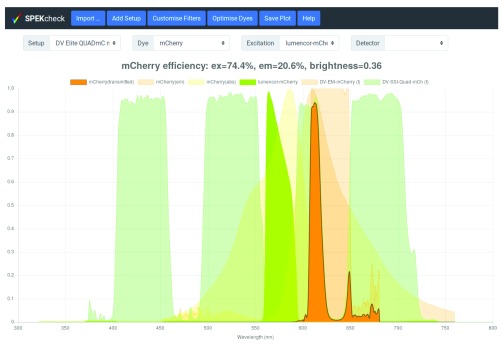
Figure 1. Display of SPEKcheck with a predefined setup for a DV Elite microscope and a mCherry sample.
It shows that this setup excites mCherry with an efficiency of 74% and collects 20.6% of the emitted light, leading to a relative brightness of 0.36. See also Figure 2 for a comparison with other dyes. The spectrum for the total transmitted light is shown in bright orange, a dark grey outline, and above all other spectra. The spectrum for the excitation light source is show in bright green, along with the dye absorption and emission spectra in a fainter orange. The emission dichroics and filters are also shown in fainter shades with different tones. Individual traces can be toggled on or off by clicking on the corresponding names in the plot legend.

