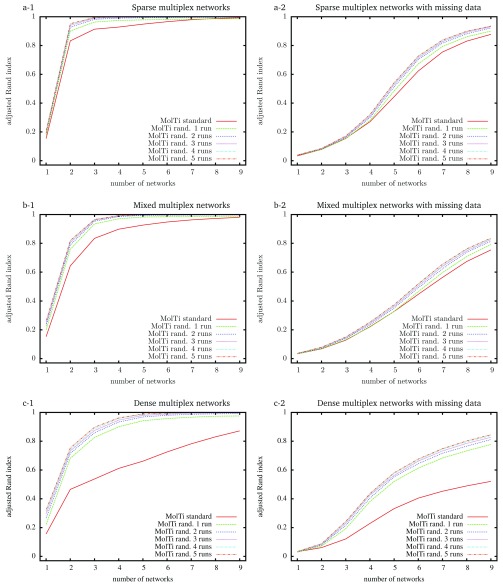
Figure 1. Adjusted Rand indexes between the reference community structure used to generate the random multiplex networks, and the communities detected by standard and randomized MolTi with 1 to 5 randomization runs.
Multiplex networks contain from 1 to 9 graph layers. The indexes are averaged over 2,000 random multiplex networks of 1,000 vertices and 20 balanced communities. Each layer of sparse (resp. dense) multiplex networks is simulated with 0.1/0.01 (resp. 0.5/0.2) internal/external edge probabilities. Mixed multiplex networks are simulated by uniformly sampling each layer among these two pairs of edge probabilities. Multiplex networks with missing data (right column) are generated by removing vertices from each layer with probability 0.5.

