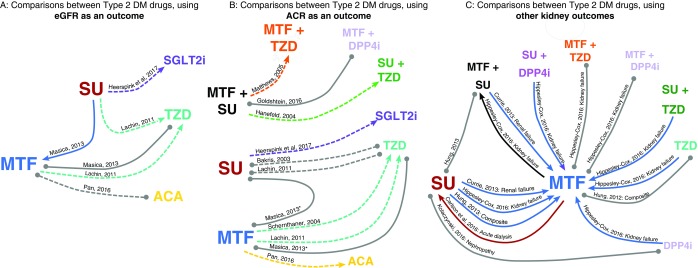
Figure 2. Graphical representation of drug comparisons and findings.
Connecting lines indicate where studies have made comparisons between drugs. Lines connect drug names and are labelled with the authors that made the comparison. Dashed line indicates randomised studies, single line indicates non-interventional studies. Findings are indicated by the colour of the line: where one drug appears to be protective, the line is the colour of the protective drug. Grey lines indicate no significant difference. E.g. Blue lines connecting metformin to sulfonylurea indicate that metformin appeared to be protective of kidney function. Arrow heads point towards the drug that appeared to be protective. One further comparison not included here. Hung et al. 2012, as two studies by Hung et al. reported similar comparison using similar data* Also includes dipstick and urine protein tests, † metformin group largely metformin, but some taking TZD or SU. Abbreviations: MTF: metformin, SU: sulfonylurea, TZD: Thiazolidinedione, DPP4i: Dipeptidyl peptidase-4 inhibitor, ACA: acarbose, SGLT: Sodium-glucose Cotransporter 2 inhibitors, GLP1: Glucagon-like peptide-1 receptor agonist, eGFR: estimated Glomerular Filtration Rate, ACR: Albumin creatinine ratio, ARF: Acute renal failure.

