Figure 5.
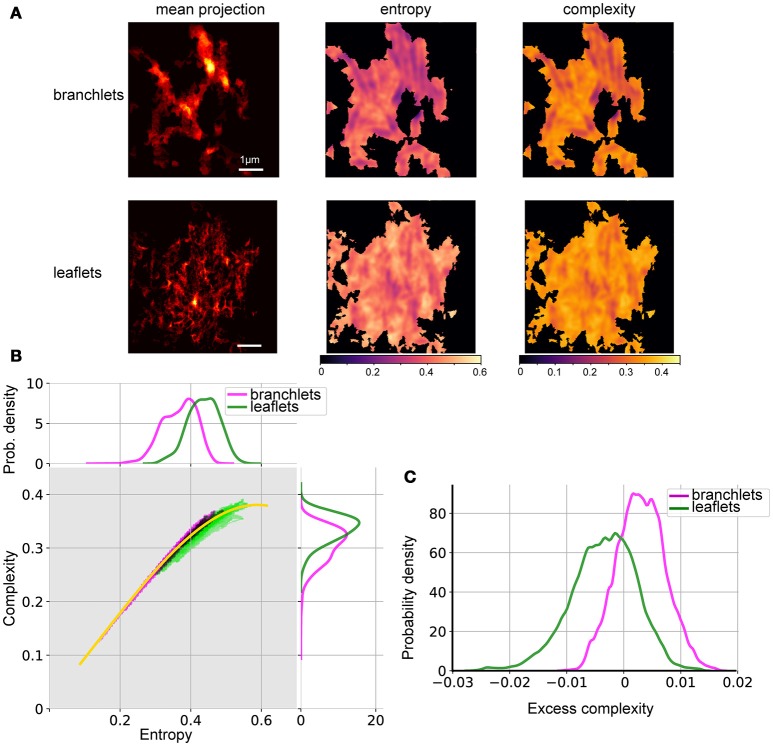
Spatial entropy and complexity of astrocytic processes. (A) Mean projection of segmented astrocytic processes (left), spatial entropy (middle), and spatial complexity (right) for astrocytic branchlets (top) and leaflets (bottom). Areas not containing any structures were assigned 0 entropy and complexity. (B) Middle, distributions of complexity and entropy for astrocytic branchlets (magenta) and leaflets (green). Color intensity is log-probability of the corresponding (H,C) pair to be found in the images, rescaled for better contrast. Black dots—overlap between the two color channels. Yellow curve: local median complexity for given entropy, taking all values (from branchlets and leaflets) together. Top, marginal distributions of entropy, kernel density estimate. Right, marginal distributions of complexity, kernel density estimate. (C) Distributions of “excess complexity,” i.e., difference between C values and local median curve, kernel density estimate.

