
Figure 3.
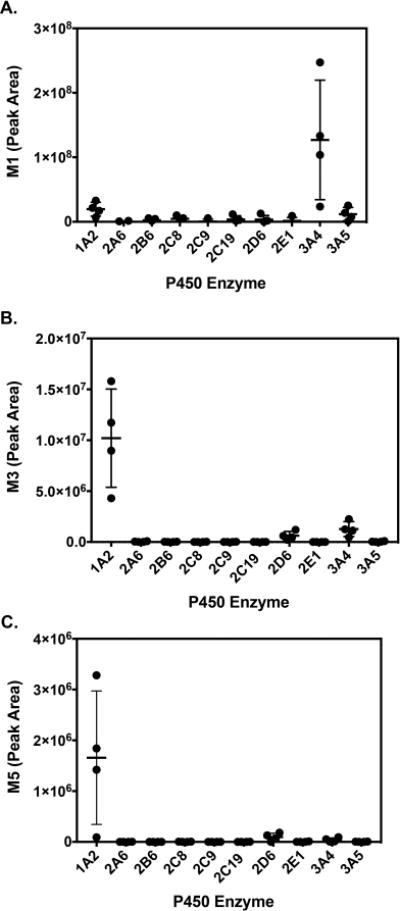
Relative P450 enzyme contribution to sunitinib metabolism. (A) M1, (B) M3, and (C) M5. Sunitinib (10 μM) was incubated with a panel of recombinant human P450 Supersomes (20 nM) in the presence of an NADPH regenerating system and supplemented with GSH (5 mM) for 10 min. Sunitinib metabolites were analyzed by LC–MS/MS analysis utilizing MRM. The MRM transitions for the metabolites indicated were as follows: M1(m/z 371 > 283), M3 (m/z 397 > 281), M5 (m/z 702 > 586). The MRM peak areas are shown for each metabolite. The results are shown as the means ± SD from four independent experiments (n = 4) performed in triplicate each.