Figure 50.

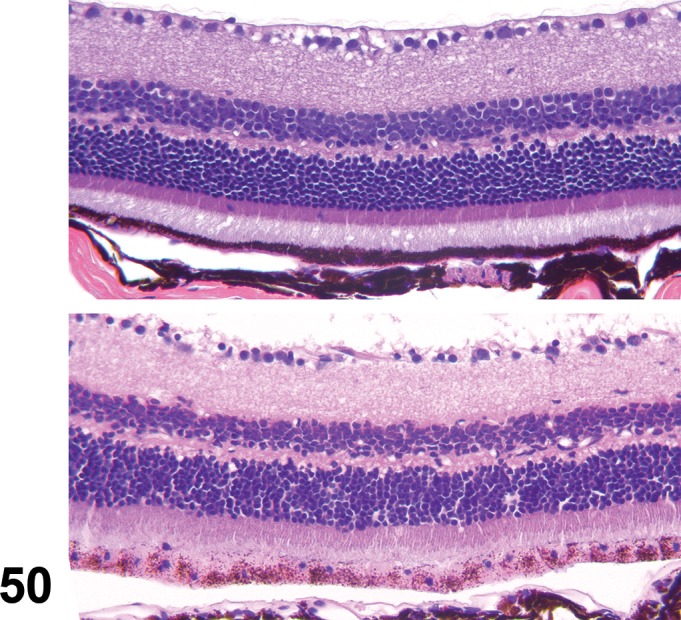
Hypertrophy; Pigmentation, decreased; RPE; mouse. Enlarged RPE are depicted in the bottom image. Note the lighter cytoplasmic pigmentation compared to the normal RPE shown in the top image.

Hypertrophy; Pigmentation, decreased; RPE; mouse. Enlarged RPE are depicted in the bottom image. Note the lighter cytoplasmic pigmentation compared to the normal RPE shown in the top image.