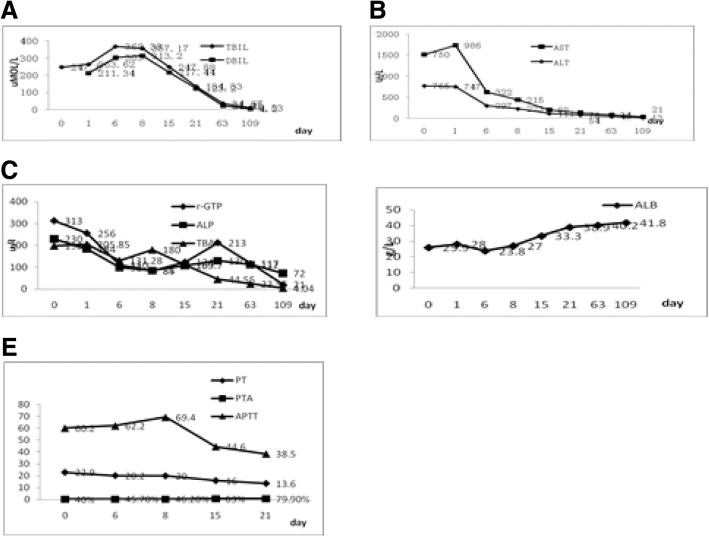
Fig. 1.
included five pictures, respectively (a, b, c, d and e), which mainly showed the trends of some laboratory test results of this patient. For example, a mainly showed the changes of TIBL and DIBL during the course of the disease; b represented the changes of ALT, AST in the course of disease; c mainly showed the changes of r-GT, ALP and TBA during the course of the disease; d represented the changes of ALB in the course of disease; And E mainly showed the changes of PT, APTT and PTA during the course of the disease

