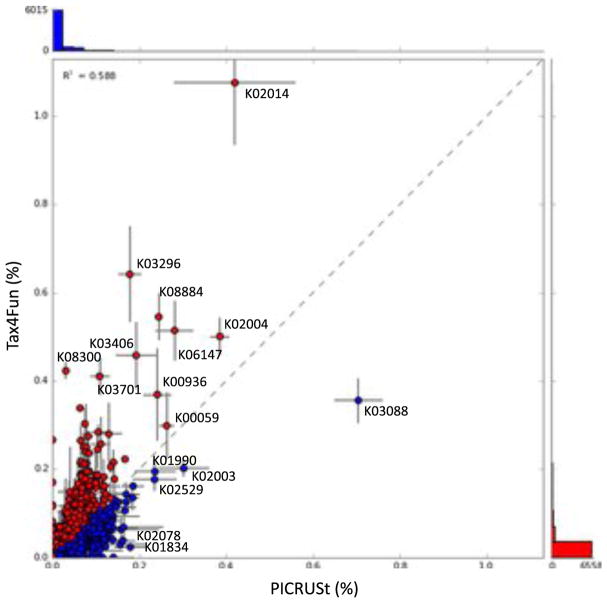
Fig. 3.
Scatter plot comparison using STAMP of the KEGG functional categories identified by Tax4Fun and PICRUSt. The dotted line shows equal distribution of KEGG functional categories between the two analyses. Circles above this dotted line represent KEGG functional categories generated by Tax4Fun, whereas the circles below generated by PICRUSt. Circles distributed closer to the dotted line represent a similar relative abundance of KEGG functional categories. Labeled circles indicate the greatest proportional differences of KEGG functional categories between Tax4Fun and PICRUSt. The KEGG functional profiles detected by both analyses represented in this figure are elaborated in the Supplementary Material (S5).

