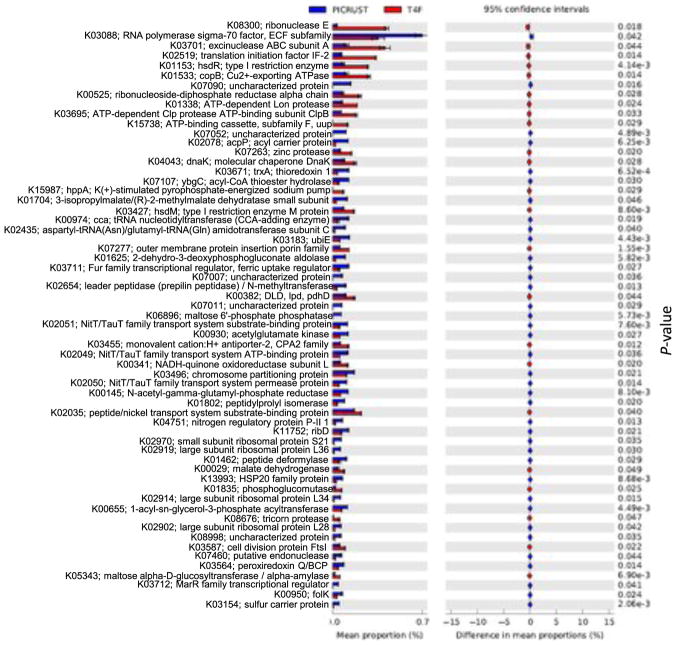
Fig. 4.
A comparison of the KEGG functional categories between PICRUSt and Tax4Fun are represented in an extended error plot. Total mean proportions in the KEGG categories are represented by the bar graph (left column); the upper bar graph (blue) represents the PICRUSt results, whereas the lower bar graph (red) resulted from the Tax4Fun analysis. The colored circles corresponding to the right column (blue and red) represent 95% confidence intervals calculated by Welch's t-test (Bluman, 2007). KEGG functional categories were filtered by p-value (0.05) and effect size (0.04). (For interpretation of the references to colour in this figure legend, the reader is referred to the web version of this article.)

