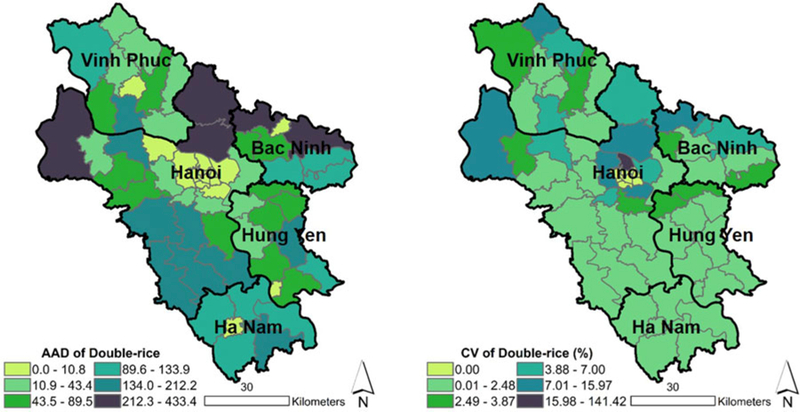
Fig. 8.

Commune-level rice variation. AAD and CV for double rice area per commune with province boundaries overlaid. Results suggest most AAD in communes with high rice mapped areas, while CV results suggest communes in the north tended to have higher percentage variation likely attributed to mapped area difficulties in more mosaicked landscapes with smaller fields.
