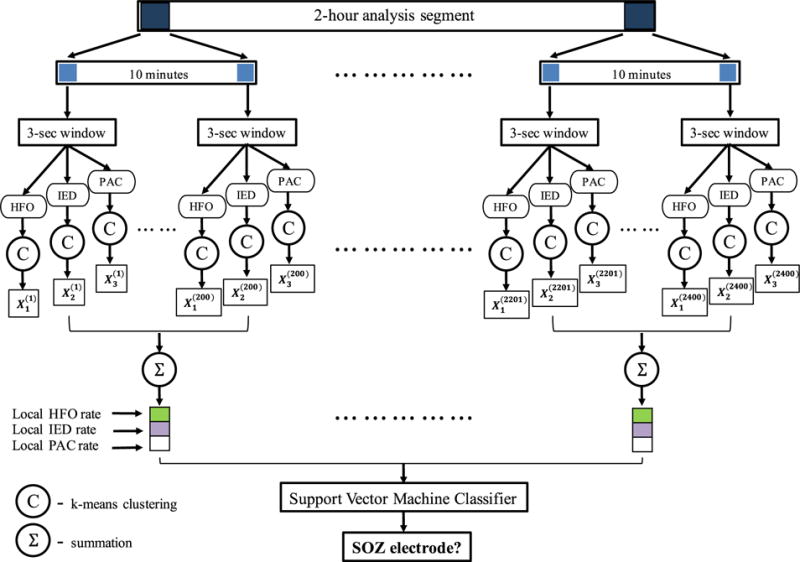
Figure 1. The overall analytic scheme of the SOZ detection algorithm utilized in this study.

A 2-hour data segment is analyzed for each patient. PAC, HFO, and IED biomarkers are extracted in 3-second epochs, and a clustering method is used to group channels based on similarities with respect to the biomarkers. These groupings are converted to binary (0, 1) observations and counted within a 10-minute window to obtain local biomarker incidence rates. These local biomarker incidence rates for the three biomarkers within all the 10-minute windows of a channel’s 2-hour recording are utilized as the features of that channel in a machine learning setting. A support vector machine (SVM) classifier, which was trained and tested using labeled training data, is used to predict whether an electrode is in an SOZ.
