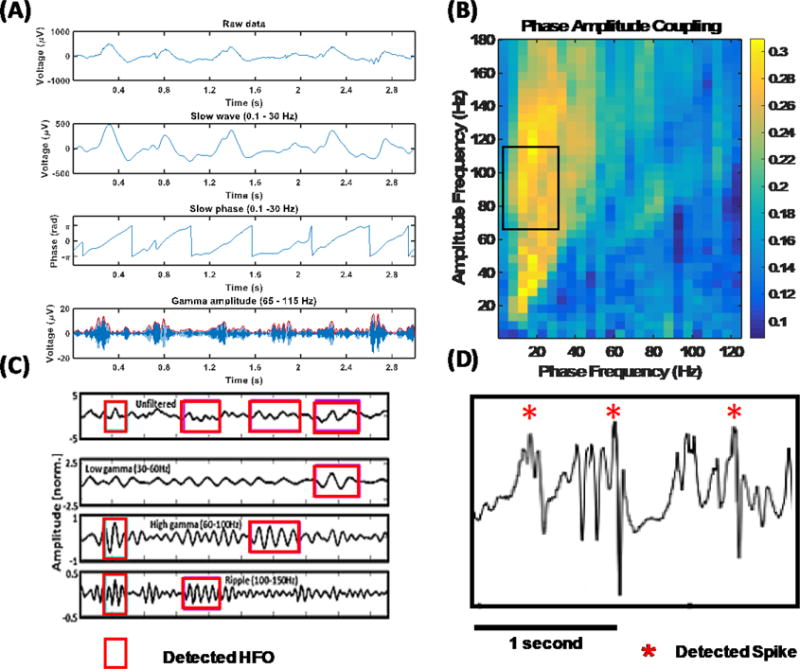
Figure 2. Phase amplitude coupling (PAC), high-frequency oscillations (HFO), and interictal epileptiform discharge (IED) detection.

(A) Detailed illustration of the PAC feature extraction algorithm. Low (0.1–30 Hz) and high (65–115 Hz) frequency components are filtered out from the raw signal. The phase of the slow wave is correlated with the high-frequency amplitude envelope to measure coupling. (B) A PAC-gram representing the average interictal PAC measured between different frequency bands. Highlighted portion indicates the low- and high-frequency bands utilized in the rest of our analysis. (C) Pictorial illustration of HFO detection. Oscillations that have an amplitude of three standard deviations above the mean and lasting for more than one complete cycle in low-gamma (30–60 Hz), high-gamma (60–100 Hz), and ripple (100–150 Hz) bands are detected. (D) An illustration of detected IEDs. Differential amplitude is standardized, and a threshold of four standard deviations around the mean was used to mark IEDs.
