
Figure 4. Results obtained using a support vector machine with interictal electrophysiological biomarkers to classify seizure onset zone (SOZ) electrodes.
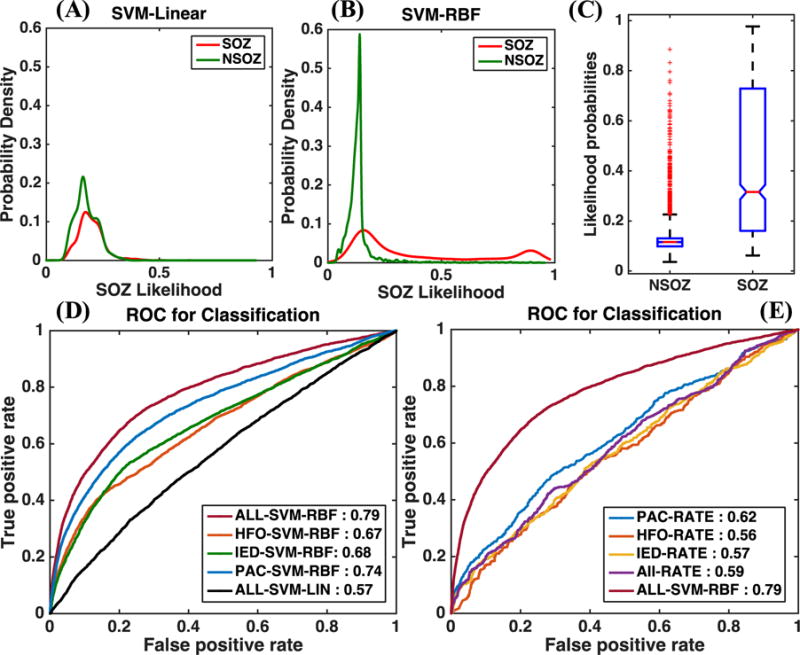
(A) and (B) show the probability densities of the likelihoods predicted by an SVM classifier for SOZ and NSOZ electrodes in the testing set for linear and RBF kernels, respectively. The RBF kernel results in less overlap between the SOZ and NSOZ probability densities. (C) Boxplot showing the range of likelihood probabilities obtained for SOZ and NSOZ electrodes when all biomarkers were used as features in an SVM classifier with an RBF kernel. (D) A comparison between the ROC curves when an SVM classifier was used with an RBF kernel for individual biomarkers and their combination, and when it was used with a linear kernel with a combination of all biomarkers. (E) A comparison between the AUCs obtained using conventional unsupervised methods that use overall rates of biomarker incidence to predict SOZ electrodes, and those obtained using our SVM-based supervised approach.