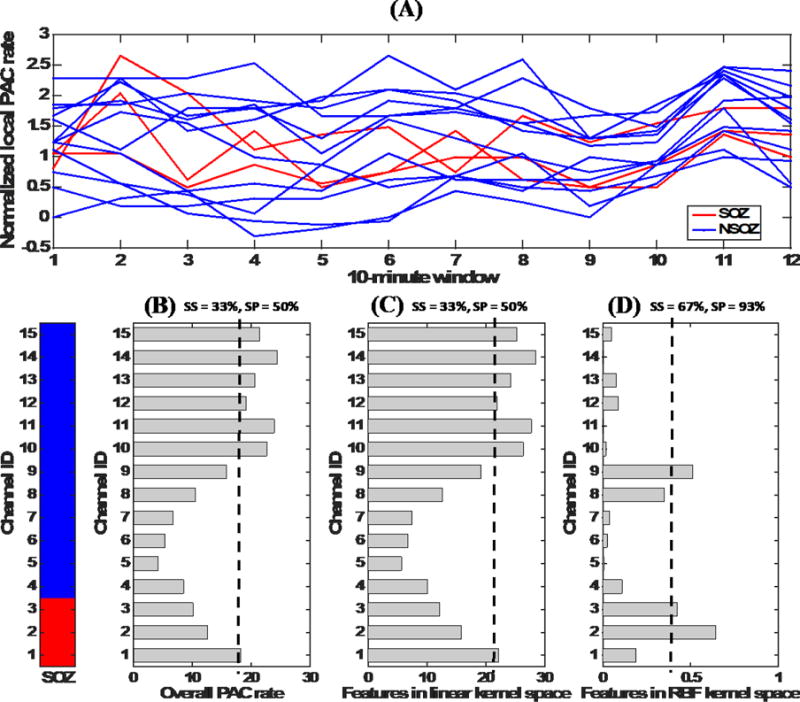
Figure 7. Temporal variability in the rates of epileptiform activity (with respect to PAC) and its relation to nonlinear classification.

This figure illustrates that the RBF kernel is more specific in capturing the similarities between electrodes with regards to their epileptiform activity patterns. (A) Normalized local PAC rates in different 10-minute intervals of SOZ and NSOZ channels of a selected patient. (B) Overall PAC rates (obtained by summing local rates) for the channels and their poor ability to classify SOZ electrodes. (SS is sensitivity, SP is specificity, and a dashed line indicates application of a threshold). (C) Features after application of a transformation using the linear kernel. This transformation does not provide any notable improvement compared to the summation approach. (D) Features after application of a nonlinear transformation using the RBF kernel. It is evident that this transformation provides better discrimination between SOZ and NSOZ channels.
