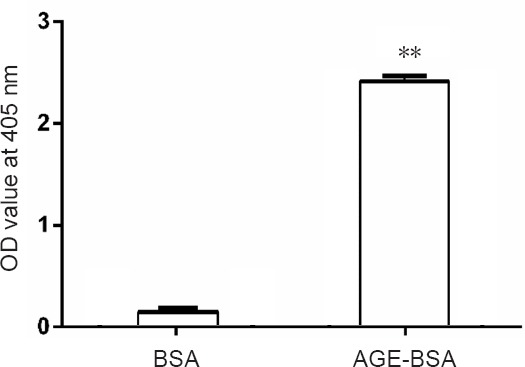
Figure 1.

Optical density (OD) value at 405 nm of advanced glycation end product bovine serum albumin (AGE-BSA) and bovine serum albumin (BSA) control at the end of the 8-week incubation.
**P < 0.01, vs. BSA group. Data are expressed as the mean ± SD (n = 6; one-way analysis of variance followed by the least significant difference test).
