
Figure 4.
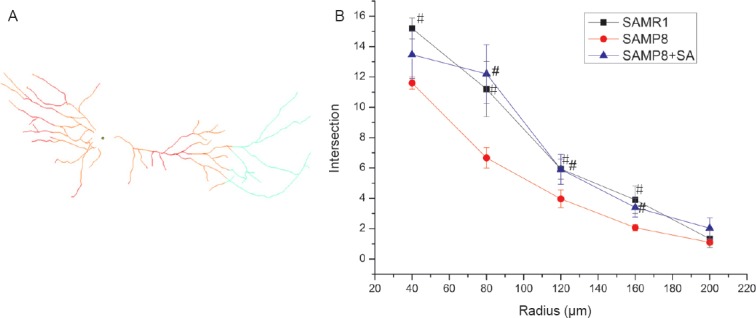
Sholl analysis of dendritic morphology in hippocampal CA1 region of SAMP8 mice at 10 days after acupuncture.
(A) Schematic diagram of Sholl analysis. (B) Sholl analysis curve of dendrites. #P < 0.05, vs. SAMP8 group (mean ± SD, n = 10, analysis of variance followed by post hoc Bonferroni testing). SAMP8: Senescence-accelerated mouse prone 8; SAMR1: senescence-accelerated mouse resistant 1; SA: Sanjiao acupuncture.