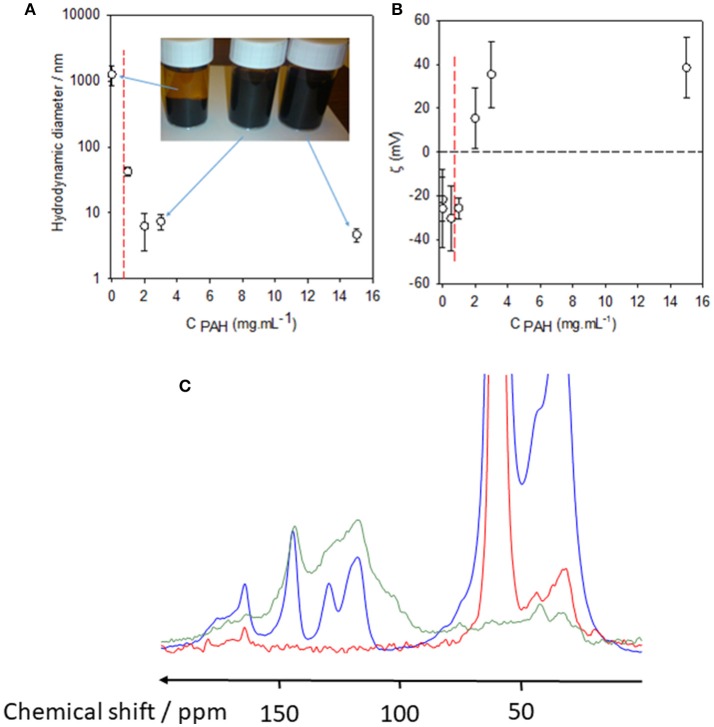
Figure 3.
Hydrodynamic diameter (A) and zeta potential (B) of PDA particles obtained after 24 h of dopamine oxidation (2 mg.mL−1 in the presence of 50 mM Tris buffer at pH = 8.5) as a function of the PAH concentration in the reaction medium. The error bars correspond to one standard deviation on the mean (n = 10 measurements). The black dashed line in (B) corresponds to the zero value of the zeta potential and is aimed to guide the eye. The vertical red dashed line corresponds to the PAH concentration (0.7 mg.mL−1) above which the PDA particles remain stable, without phase separation, even after prolonged storage. The inset in (A) corresponds to a picture of the PDA containing solutions taken 7 days after the completion of the oxygenation of the dopamine solutions in the presence or in the absence of PAH as indicated with blue arrows. (C) 13C CP-MAS Spectra of the PAH-only sample (red curve), PAH-PDA (blue curve), and pristine PDA (green curve). The PAH concentration was 2 mg.mL−1 in the synthesis batch as well as in the reference PAH solution. Data have been taken from Mateescu et al. (2016) with authorization.

