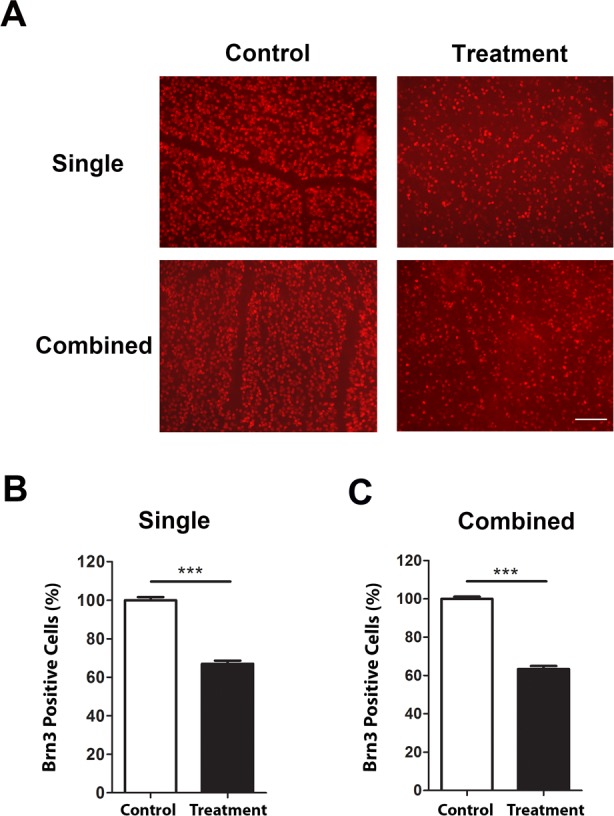
Figure 5.

Immunofluorescent microscopic analysis of retinal ganglion cell loss after single or combined treatment in mice aged 5 weeks. (A) Representative images showing reduced Brn3a+ cells (red) in the retina 7 days after single (upper panels) or combined (lower panels) laser treatment, as compared with untreated contralateral retina. Scale bar, 100 μm. Summarized data are presented in (B) and (C) for single and combined treatment, respectively. ***P < 0.001 (n = 9/group).
