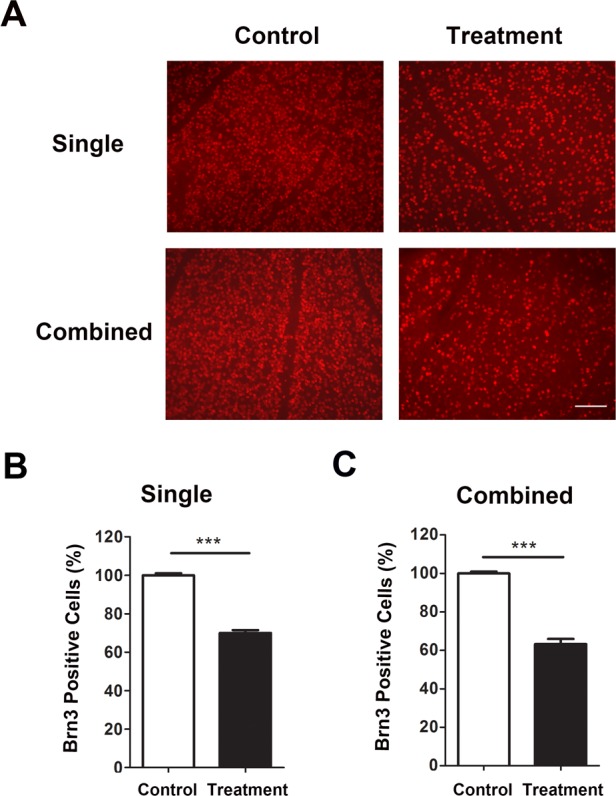
Figure 6.

Immunofluorescent microscopic analysis of RGC loss after single or combined treatment in mice aged 8 weeks. (A) Representative images showing reduced Brn3a+ cells (red) in the retina 7 days after single (upper panels) or combined (lower panels) laser treatment, as compared with untreated contralateral retina. Scale bar: 100 μm. Summarized data are presented in (B) and (C) for single and combined treatment, respectively. ***P < 0.001 (n = 9/group).
