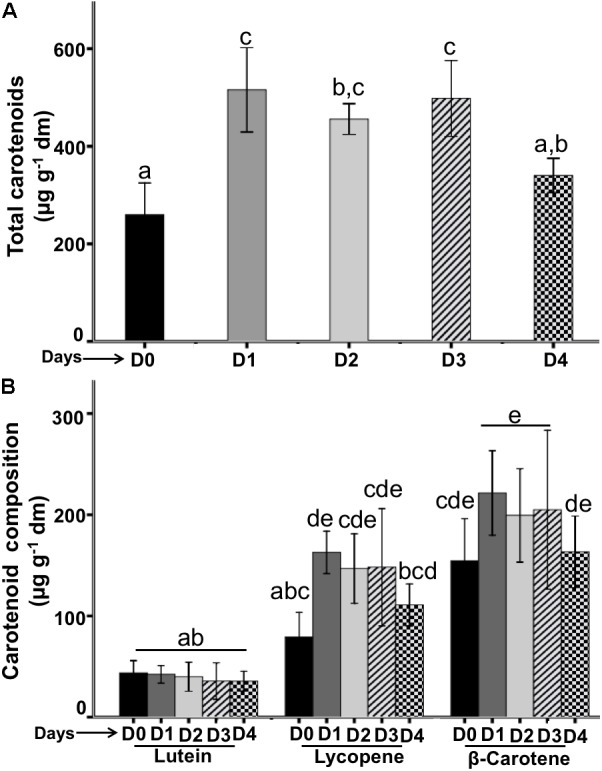
FIGURE 6.

Quantification of carotenoids from flowers during the flower lifetime. (A) Total carotenoids contents were quantified each 24-h. (B) Composition of carotenoid types during the flower lifetime. Bars represent means ± SE (N = 6 for separately experiments) of carotenoids concentrations (μg per g flower dry mass).
