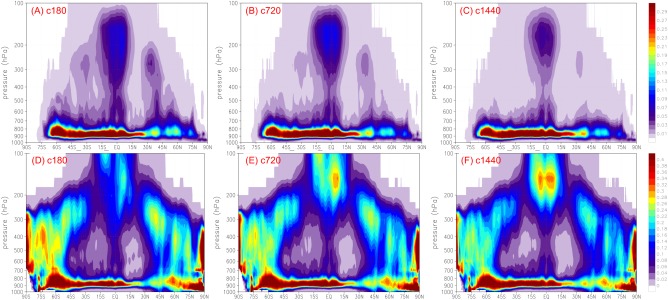
Figure 2.

Zonal mean of the cloud fraction from (top row) the convective parameterization only and the total, i.e., (bottom row) including the grid‐scale, averaged over the 3 day run. From left to right, model resolution increases from c180 (∼50 km), c720 (∼12 km), and to c1440 (∼6 km). The top and bottom color bars have different range of values.
