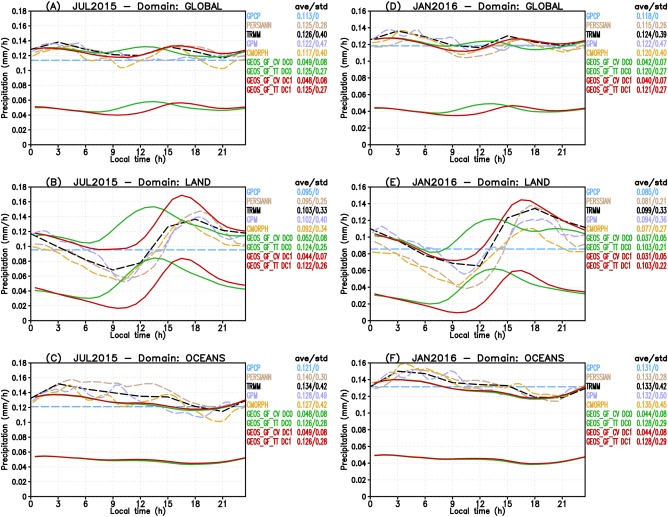
Figure 3.

Diurnal cycle of precipitation from remote sensing‐derived observations and NASA GEOS GCM with the GF scheme. (a–c) July 2015 monthly averaged results for the global, land and ocean domains, respectively. (d–f) As before but for January 2016. Observations are shown in dashed lines. Model results are shown regarding total precipitation (GEOS GF TT) and only from GF convection parameterization (GEOS GF CV) with both using continuous lines. Models results in red and green colors correspond to simulations including (DC1) or not (DC0) the diurnal cycle closure, respectively.
