Figure 8.

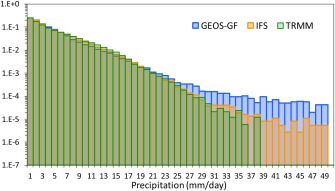
Histogram of the precipitation amounts of TRMM, and the GCMs IFS and GEOS‐GF binned in 1 mm d−1. Note that the vertical axis applies a log scale.

Histogram of the precipitation amounts of TRMM, and the GCMs IFS and GEOS‐GF binned in 1 mm d−1. Note that the vertical axis applies a log scale.