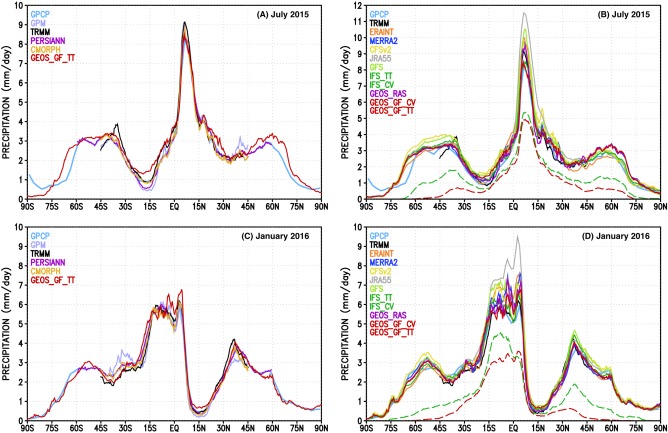
Figure 9.

Zonally averaged monthly mean of precipitation (mm d−1) for July 2015 and January 2016. Data (left column) from remote sensing based observations and (right column) by models weather forecasts and global atmospheric reanalysis are shown with continuous lines. Model GEOS GF total precipitation appears in both columns. On the right side, dashed lines represent the precipitation amount associated with the convection parameterizations of GEOS GF and IFS.
