
Figure A1.
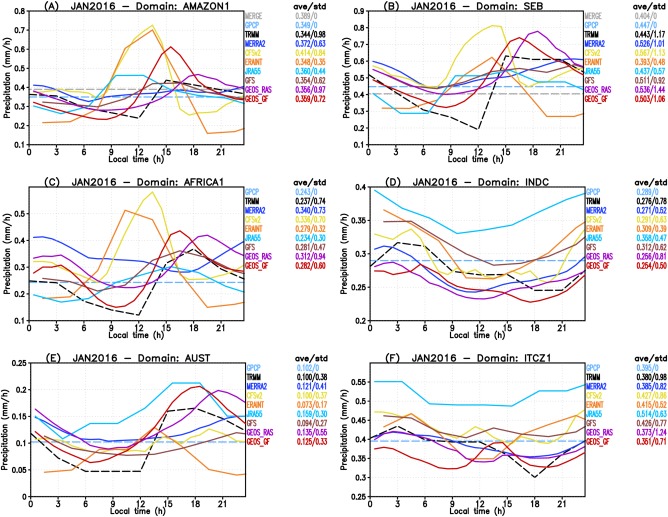
Diurnal cycle of precipitation from remote sensing‐derived observations and several models forecast and reanalysis. The plots show January 2016 monthly averaged results for the subdomains (a) AMAZON1, (b) SEB, (c) AFRICA1, (d) INDC, (e) AUST, and (f) ITCZ1. See Figure 4 for definitions of these regions. Observations (model results) are shown in dashed (continuous) lines.