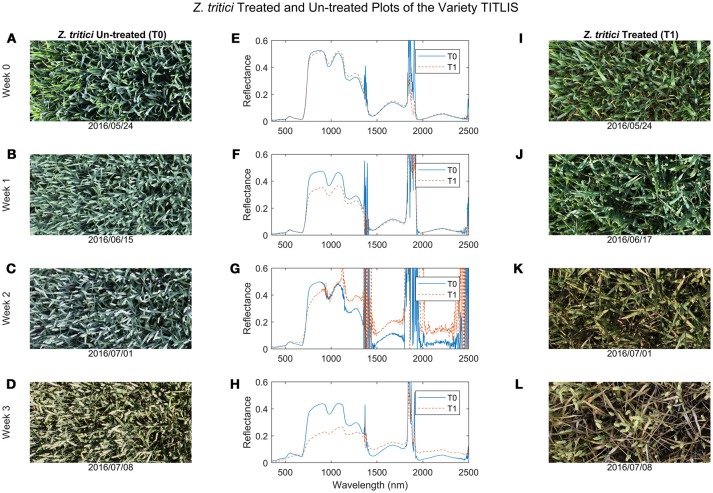
Figure 1.
Comparisons of wheat canopy RGB images and hyperspectral reflectance curves between the Zymoseptoria tritici un-treated (T0, images I–L) and treated (T1, images A–D) plots at four periods. (A,E,I) Week 0 was at the end of May 2016; (B,F,J) Week 1 was at mid-June 2016; (C,G,K) Week 2 was at the beginning of July; and (D,H,L) Week 3 was at mid-July 2016 (see also Table 1 for a full list of sampling periods and corresponding growth stages).

