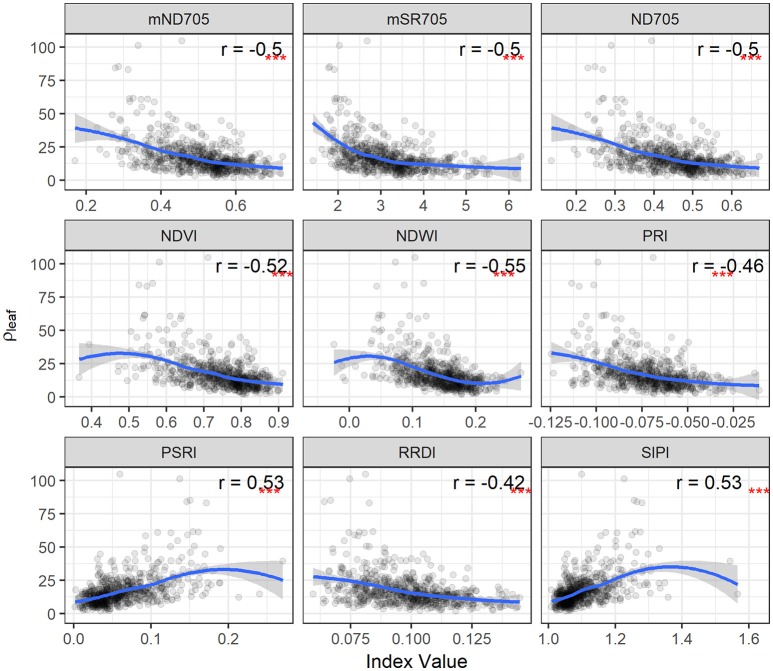
Figure 5.
STB density of pycnidia per unit leaf area (ρleaf) plotted as a function of spectral indices for the second collection. Correlation coefficients (r) are for the Spearman's correlations between the spectral indices and ρleaf (***p < 0.001). Loess fit lines are added to the scatter plot to show the trend of the relationship. Results are based on the data of the whole population (335 varieties) used in the main experiment.

