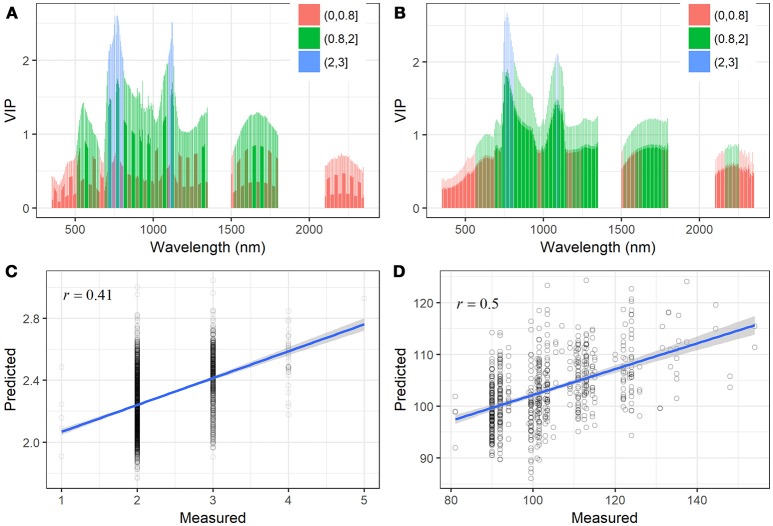
Figure 7.
VIP scores of the PLSR models for (A) the STB scores and (B) AUDPC. The three value breaks show different ranges of VIP values, which indicates the most influential wavelengths. PLSR model predicted values of (C) STB scores and (D) AUDPC plotted against their measured values with linear fit. Pearson and Spearman correlations produced the same correlation coefficients (r).

