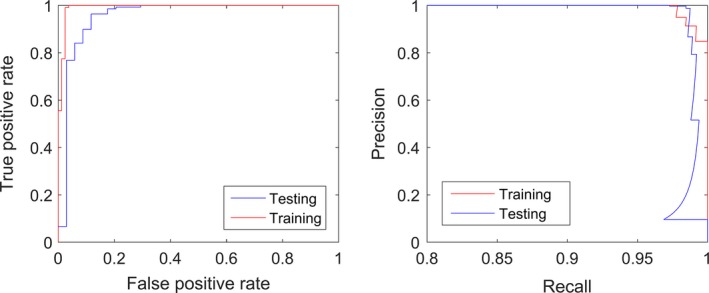
Figure 6.

ROC curve (Left) and Precision and Recall Curve (Right) for Temperate vs. Tropical Forests classification. ROC describes changes in false positive rate as true positive rate improves. Precision & Recall describes changes in positive predictive rate (Precision) as true positive rate (Recall) improves. The wedge/step in the bottom right of the plot for the testing data indicates that a range of Recall rates were observed 0.1 Precision
