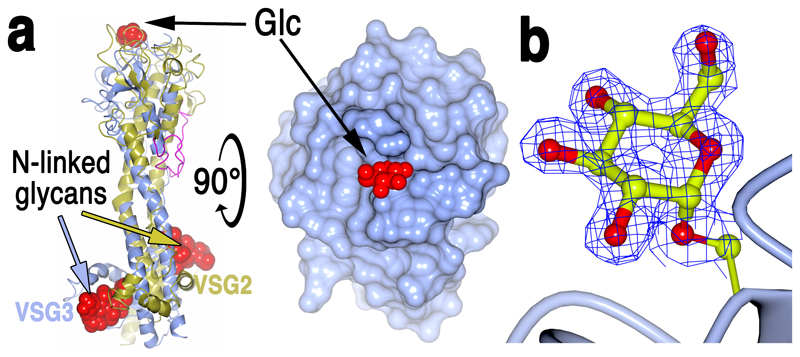
Fig. 2. Structural identification of O-linked Carbohydrate on VSG3 Surface.
(a) Left is a superposition of VSG3 (blue) and VSG2 (gold) with conserved purple “top loop.” The GlcNAc2 cores of the lower lobe N-linked glycans of the two VSGs are displayed as red space-filling atoms (coloring of arrows pointing to the glycans indicates to which VSG they belong). On the top surface of the upper lobe is a red space-filling representation of the α-glucose moiety attached to S317 of VSG3. A 90-degree rotation of the left model is rendered with molecular surfaces (blue for VSG3 protein, red for a space-filling representation of the glucose). (b) 1.4 angstrom resolution electron density map from the refined model of VSG3 clipped to the volume around the modeled glucose (Glc). S317 is shown connected to a ribbon diagram representation of the protein main chain (blue).

