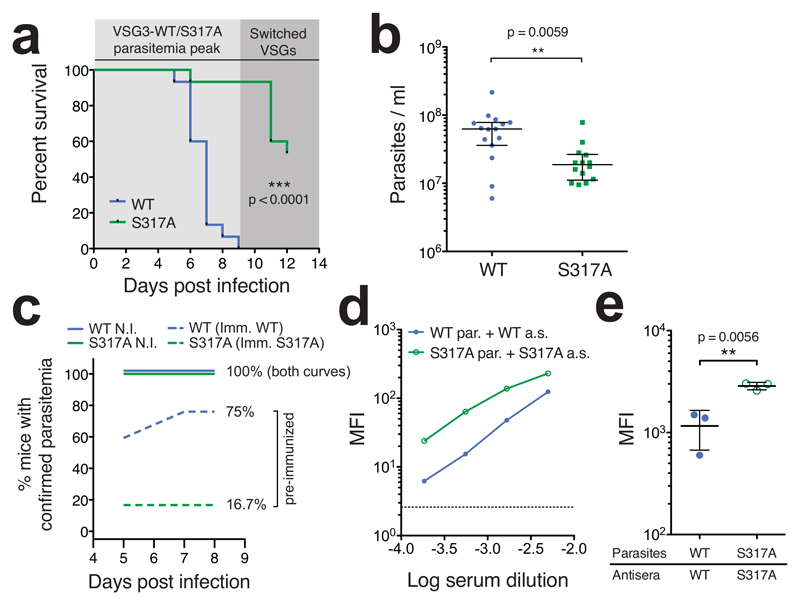
Fig. 4. Presence of O-linked glycan impairs immune function.
(a) Survival of mice infected with trypanosomes expressing VSG3WT or non-glycoslyated mutant VSG3S317A (n = 15 mice/group). Shaded regions represent sequential “peaks” of parasitemia. Data are combined results from two experiments with independent clone sets and representative of results within each set (n = 5 or 10 mice/group, see Supplementary Fig. 8). Statistical analysis was performed using a two-sided log-rank test (Mantel-Cox). (b) Parasitemia levels at day 5 post-infection. Data are combined from two independent clone sets as in (a) (separated in Supplementary Fig. 8). Statistical values were calculated by two-sided Mann-Whitney test; bars represent median and interquartile range (c) Emergence of parasitemia in non-immunized (N.I.) and pre-immunized mice. N.I. data are from infections shown in (a) and (b) (n = 15 mice/group). Pre-immunized mice (n = 12 mice/group) were inoculated with UV-irradiated trypanosomes expressing VSG3WT or VSG3S317A (Imm. WT or S317A, respectively) on days -8 and -5 relative to challenge. Challenge injection contained live parasites expressing the same VSG to which the mice were immunized. Mice were permanently scored as “parasitemia confirmed” when parasites were first detected via blood smear. (d) Comparison of VSG3WT or VSG3S317A-elicited IgM antisera (a.s.) binding to live VSG3WT or VSG3S317A-expressing parasites (par.). Binding was measured by FACS analysis using dilutions of primary antisera, visualized after counterstaining with FITC-labeled anti-mouse-IgM, and reported as mean fluorescence intensity (MFI). Data are shown for one antiserum sample per VSG type. This experiment was performed twice with similar results. (e) Similar to (d) but with a single dilution (1:2000) of distinct antisera, elicited by infection of multiple mice (n = 3 independent antisera/VSG type; error bars represent mean ± SD). Statistical values were calculated by two-sided t-test, assuming normal distribution, and similarity of variances was confirmed by F test. For additional statistical analyses see Supplementary Fig. 9. For (d) the dotted line represents background MFI. This experiment was performed once.

