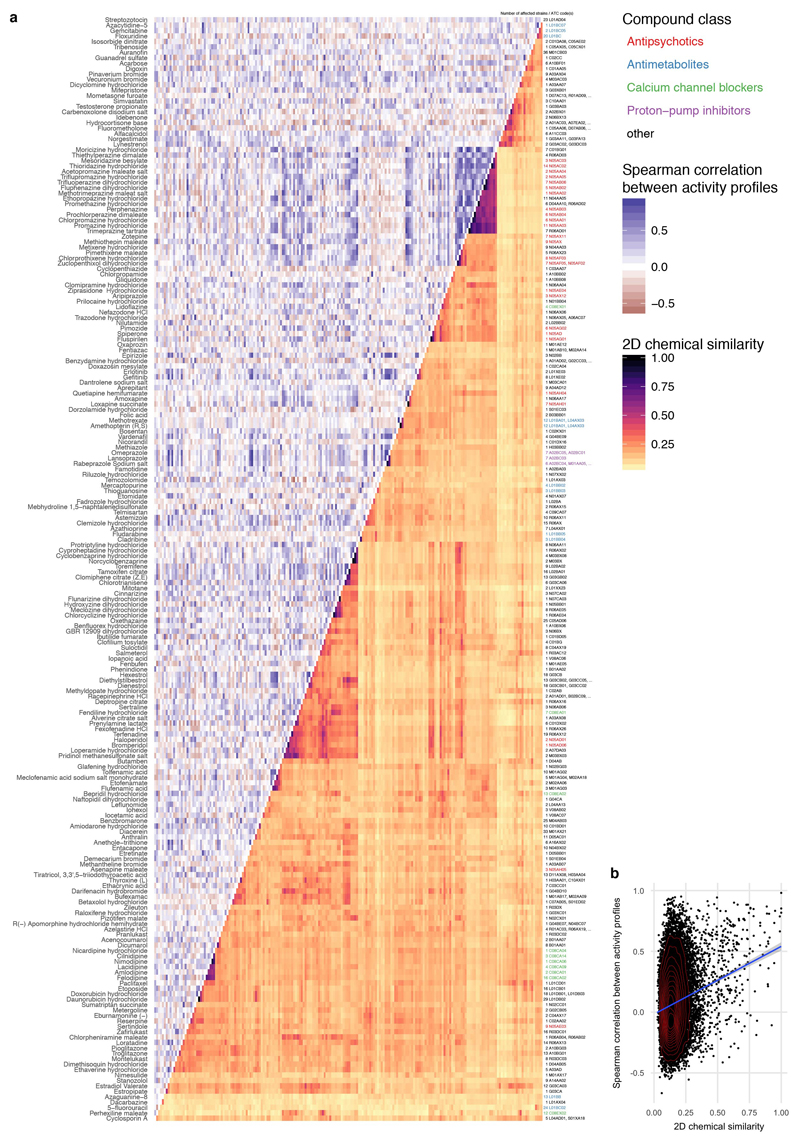
Extended Data Figure 11. Comparing chemical similarity of drugs and similarity of hit profiles across gut microbes.
a. Heat map of anticommensal activity and chemical similarities for all active human-targeted drugs in our screen. Drugs are clustered according to chemical similarity. Colors represent the median of drug pairwise Spearman correlations within and between subgroups depicted, calculated from the growth profiles of the 40 strains in each drug (p-values) or their Tanimoto scores 63. Several prominent groups are color coded. Only drugs of some classes share both chemical similarity and have similar effects on the 40 strains – for example: phenothiazine antipsychotics & antihistamines (N05A & R06AD), structurally similar dibenzothiazepines & dibenzoxazepines for antipsychotics and antidepressants (N05AH & N06AA), PPIs (A02BC), antiestrogens (L02BA), synthetic estrogens (G03CB) and anti-inflammatory fenamates (M01AG & M02AA06). b. A mild correlation exists between chemical similarity (Tanimoto scores) and anticommensal activity similarity (drug pairwise Spearman correlations) - rs = 0.12 (p-value of Spearman’s test < 2e-16).

