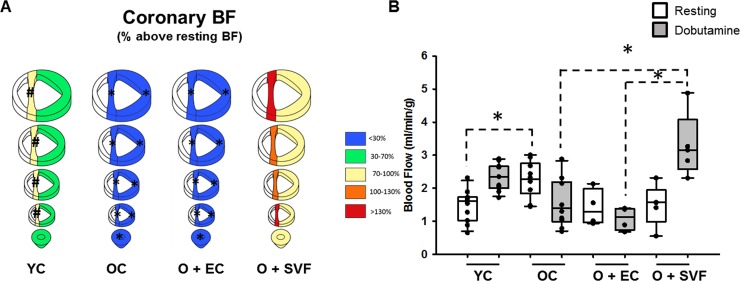
Fig 3. Measurement of heart perfusion using microspheres.
Coronary blood flow was evaluated by the injection of two different stable isotope-labeled microspheres during rest and dobutamine infusion. After explant, the LV was divided into 4 rings above the apex up to papillary region, then rings were separated by septum and free LV wall. Percent blood flow above resting for each section is depicted on the left, P ≤ 0.05 vs. O+SVF (*) and vs. OC (#) (A). Absolute LV blood flow (ml/min-1.g-1, averaged across all sections of one heart) during rest was significantly higher in OC compared to YC, p < .05 (#); following dobutamine challenge, O+SVF showed increased blood flow compared to OC and O+EC, p < .05 (*) (B). Data are presented as mean ± SD, analyzed with one-way ANOVA followed by Bonferroni post hoc test of the following number of animals in each group: YC n = 11, OC n = 11, O+EC n = 4, O+SVF n = 5.

