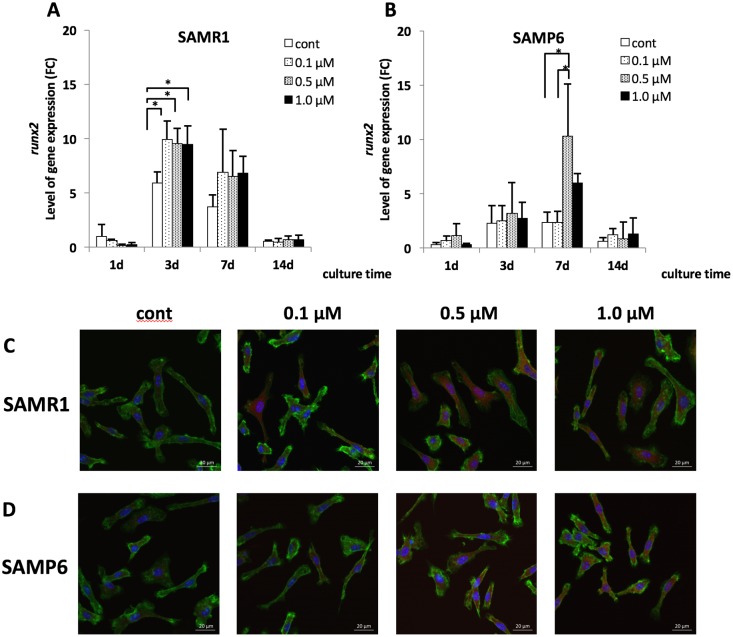
Fig 3. runx2 mRNA expression (A, B) and protein expression of Runx2 (C, D) in SAMR1 and SAMP6 BMSCs.
(A, B) The expression level of runx2 mRNA was shown as FC (fold chnage). (ΔΔCt method, baseline = 1day on control in SAMR1) *P < 0.05 runx2 mRNA expression was significantly increased at 0.1μM, 0.5μM and 1.0μM fluvastatin at 3 days of culture in SAMR1, and at 0.5 μM at 7 days in SAMP6. (C, D) BMSCs were treated with fluvastatin for 7days. Red: Runx2, blue: DAPI and green: actin. Scale bar = 20 μm.

