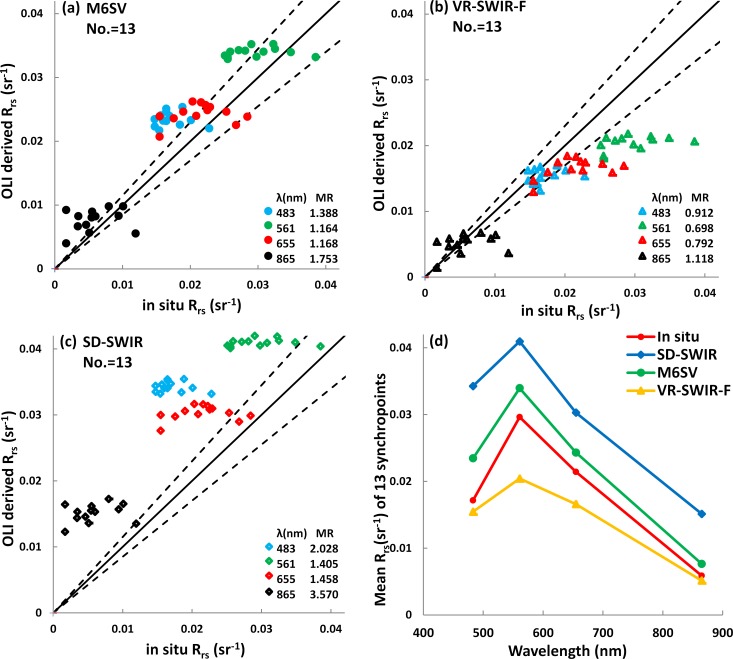
Fig 4.
L8/OLI Rrs derived using the (a) M6SV, (b) VR-SWIR-F, and (c) SD-SWIR models plotted against in situ measurements from Taihu Lake at 13 synchropoints. The solid line is a 1:1 line; the dashed lines represent ± 15% error around the 1:1 line. The mean ratio (MR) represents the ratio between the model-derived Rrs and in situ-measured Rrs for each band. (d) A comparison of the mean Rrs spectra from the three models and the in situ measurements at the 13 synchropoints.

