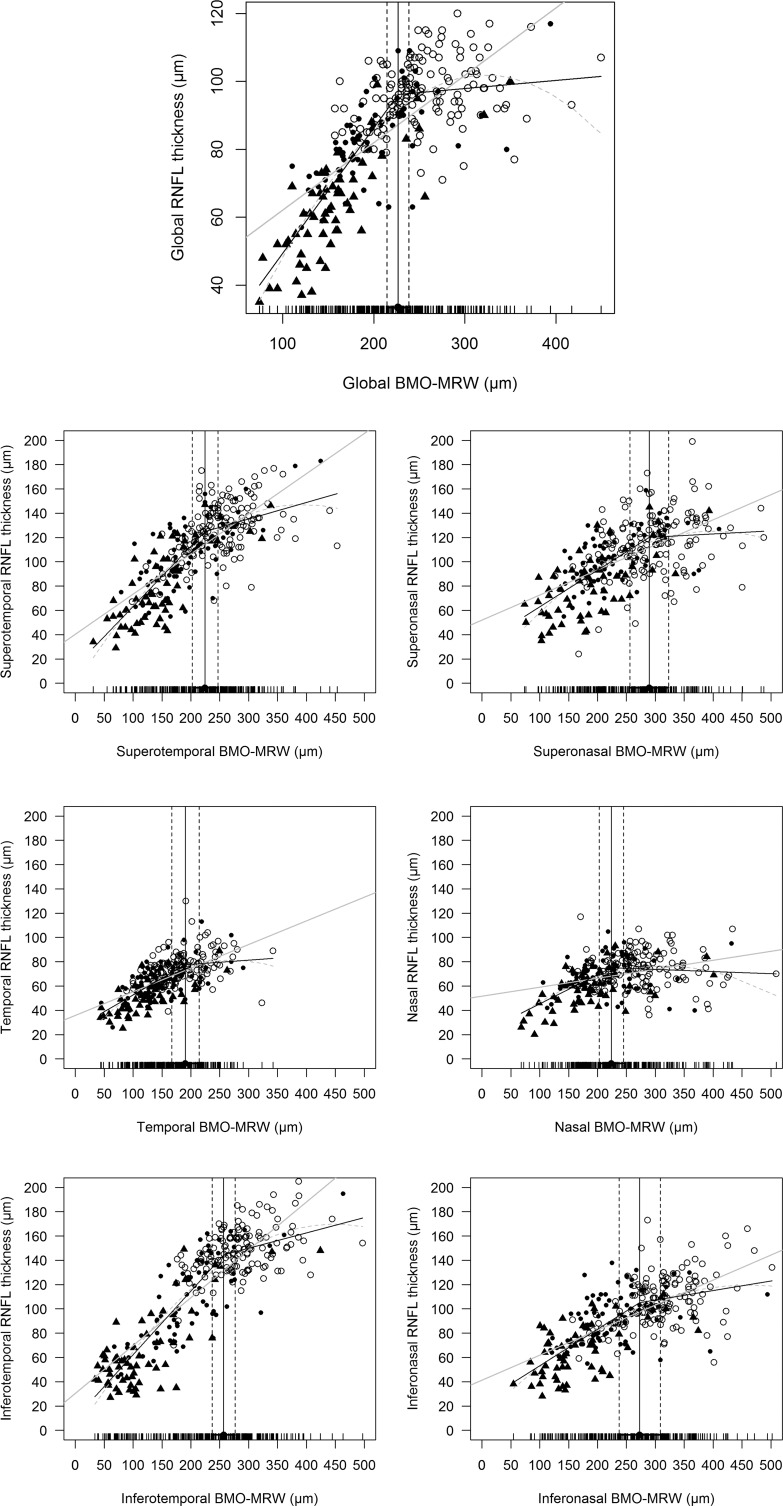
Figure 1.
Scatterplots between pRNFLT and BMO-MRW values globally (top) and sectorally. Three regression lines are shown: black line, broken-stick model; gray line, linear model; dotted line, quadratic model. Circles represent normal subjects, dots are early glaucoma patients, and triangles are advanced glaucoma patients. Except for the temporal and superonasal sectors, the broken-stick model afforded the best fit.

