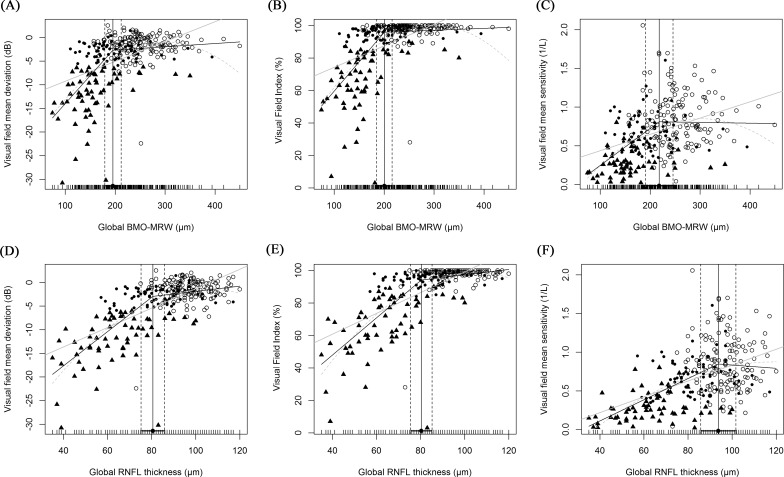
Figure 2.
Scatterplots of visual field and OCT parameters. Three different visual field parameters (MD, VFI, and 1/L) were employed. (A–C) are the scatterplots between visual field data and BMO-MRW. (D–F) are those between visual field data and pRNFLTs. Three regression lines are shown: black line, broken stick model; gray line, linear model; dotted line, quadratic model. Circles represent normal subjects, dots are early glaucoma patients, and triangles are advanced glaucoma patients. The locations of the tipping points between the visual field and BMO-MRW data were similar regardless of the visual field scale used (76.6%, 78.6%, and 74.9% in [A]–[C], respectively). However, when the visual field and pRNFLT data were compared, the tipping points differed by the visual field scale (83.4%, 83.1%, and 97.4% in [D]–[F], respectively).

