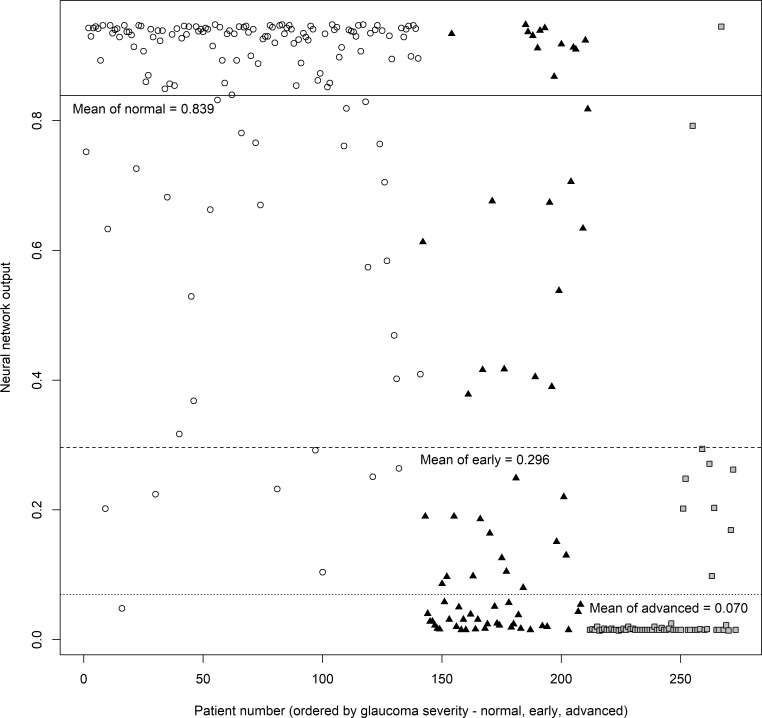
Figure 4.
The output values of the artificial neural network for the validation group. Output values close to 1.0 are more likely to be normal than those close to 0, which indicate glaucoma. Circles are normal subjects, triangles are early glaucoma patients, and rectangles are advanced glaucoma patients. The solid horizontal line is the average output value of normal subjects, the dashed horizontal line is that of early glaucoma patients, and the dotted horizontal line is the average output of advanced glaucoma patients. The average output values were 0.839, 0.296, 0.070 (normal, early glaucoma, advanced glaucoma subjects, respectively). The difference in the average output between normal and early glaucoma and early and advanced glaucoma subjects were all statistically significant (all P < 0.001, Mann-Whitney U test).

