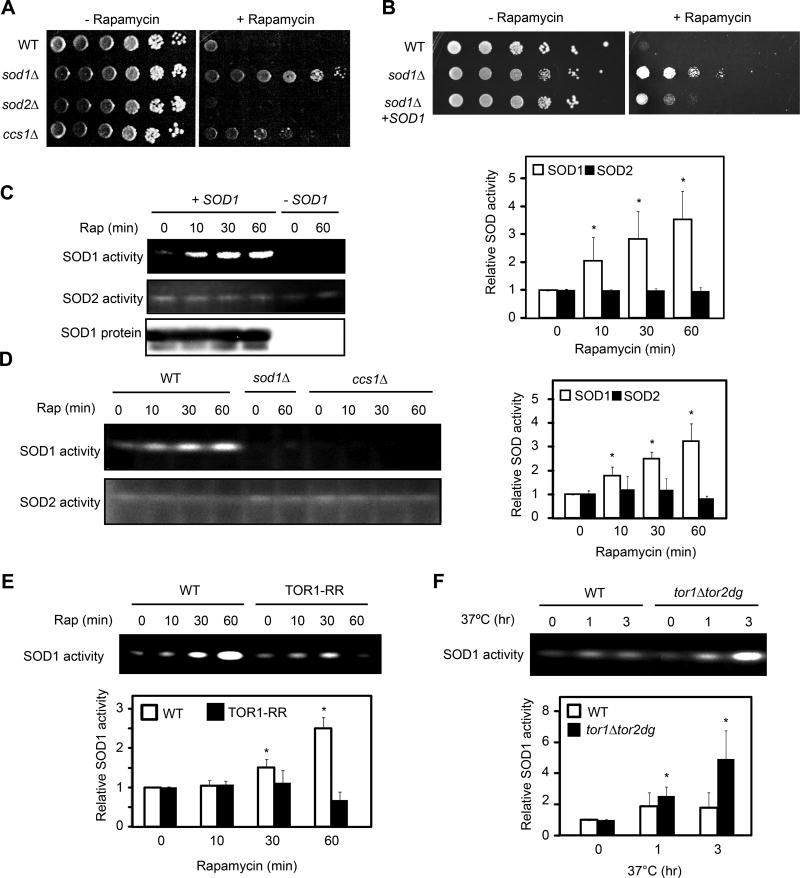
Figure 1. TORC1 negatively regulates SOD1 activity in yeast.
(A) Deletion of SOD1 renders the rapamycin resistant phenotype in yeast. Wild type (WT), sod1Δ, sod2Δ and ccs1Δ cells were serially diluted (10-fold), spotted onto YPD plates without or with a sub-inhibitory concentration of rapamycin (1 nM), and incubated at 30°C for 2 (− rapamycin) to 5 (+ rapamycin) days.
(B) Plasmid-borne SOD1 suppresses the rapamycin resistant phenotype of sod1Δ strain. WT, sod1Δ and sod1Δ [SOD1-MYC9] yeast strains were assayed for rapamycin sensitivity as above.
(C) Rapamycin rapidly activates the activity of SOD1, but not SOD2. Yeast cells were treated with rapamycin for different times and the activity of SOD1 and SOD2 were examined by the in-gel SOD activity assay. Right panel shows quantification of the results (expressed as relative activity to time zero; mean ± S.D.; n = 3; * p < 0.05, Student’s t-test). sod1Δ strain was used as a negative control.
(D) Rapamycin activation of SOD1 is dependent on its copper chaperone CCS1. WT, sod1Δ and ccs1Δ cells were treated with rapamycin for different times. Right panel shows quantification of the results (mean ± S.D.; n = 3; * p < 0.05, Student’s t-test).
(E) SOD1 activation by rapamycin is a result of TORC1 inhibition. Yeast cells expressing TOR1 or TOR1-RR were treated with rapamycin and assayed for the SOD activity. Quantification of SOD1 activity is shown in the lower panel (mean ± S.D.; n = 3; * p < 0.05, Student’s t-test).
(F) Genetic inactivation of TORC1 stimulates SOD1 activity. WT and tor1Δtor2-dg strains were shifted to the restrictive temperature (37°C) for different times, and SOD1 activity was determined by the in-gel assay. Lower panel shows quantification of SOD1 activity (mean ± S.D.; n = 3; * p < 0.05, Student’s t-test).
See also Figures S1.

