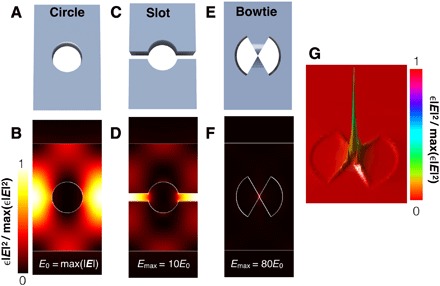
Fig. 1. Comparison of light concentration in different photonic crystal unit cells.

(A and B) Traditional circular unit cell of a photonic crystal and its electric energy profile at the dielectric mode band edge. (C and D) Slotted photonic crystal unit cell and its electric energy profile at the dielectric band edge. (E and F) Bowtie photonic crystal unit cell and its electric energy profile at the air band edge. The tip of the v-groove is modeled to extend down to the middle of the silicon slab. (G) 3D profile of the mode in the bowtie unit cell showing the electric energy distribution. All profiles are taken at the middle of the silicon slab. All color maps are scaled according to the minimum and maximum electrical energy values of each individual unit cell. The maximum electric field amplitude in each unit cell scales as follows: traditional circular unit cell = 1 (normalized), slotted unit cell = 10, bowtie unit cell = 80.
