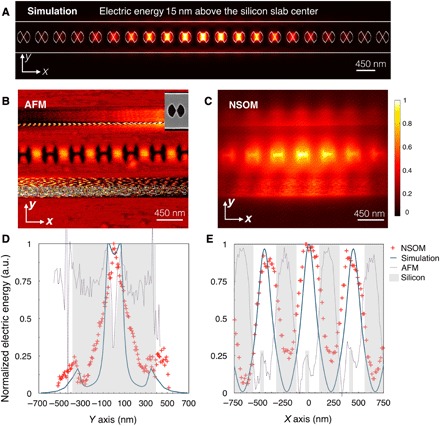
Fig. 4. Analysis of spatial confinement via NSOM measurements.

(A) Schematic of bowtie photonic crystal cavity with overlay of simulated electric energy 15 nm above the silicon surface, where the NSOM measures the scattered field. (B) AFM measurement and (C) corresponding electric energy distribution, as measured by NSOM. The inset in (B) shows a higher-resolution SEM image of one of the bowtie unit cells from the measured cavity. (D and E) Simulated and NSOM-measured near-field profile along the y direction and x direction, respectively, along with superimposed AFM line scan.
