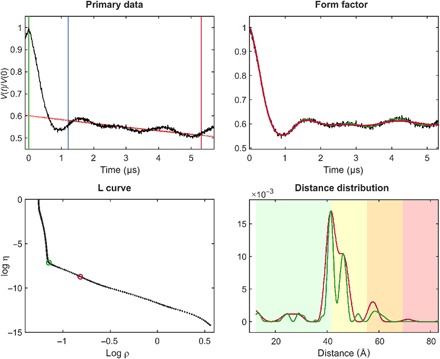
Fig. 1. Standard Tikhonov regularization processing, illustrated using site pair V96C/I143C in the lumenal loop of a double mutant of LHCII, with iodoacetamido-PROXYL spin labels attached to the indicated cysteines (64).

For the primary data (top left), the zero time (green vertical line) is determined using moment analysis in the vicinity of the intensity maximum. The optimal starting time for background fitting (blue vertical line) is determined by minimizing probability density at the maximum distance. Data have been cut by 400 ns at the end (red vertical line) to minimize the influence of the artifact arising from overlapping pump and observe pulse excitation bands. The stretched exponential background fit is shown as a solid red line (where fitted) and as a dotted red line (where extrapolated). The background-corrected data (form factor, black) are shown in the top right panel together with fits using the regularization parameter corresponding to the origin distance criterion (red) and maximum curvature criterion (green). These two choices are also indicated in the L-curve (bottom left). The bottom right panel shows distance distributions computed with these two regularization parameters in matching color. Pastel background shading indicates distance ranges where the shape of the distribution is expected to be reliable (green), where mean distances and widths are expected to be reliable (yellow), where only mean distances are expected to be reliable (orange), and where data should not be interpreted (red). These ranges are derived from the duration of the primary data (7).
