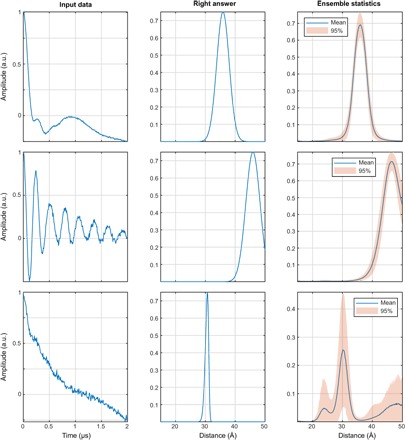
Fig. 18. A demonstration of exchange coupling resilience.

The networks were trained on the database where each DEER trace has an exchange coupling randomly selected within the ±5-MHz interval (top row, J = –1.9 MHz; middle row, J = +2.9 MHz; bottom row, J = –3.6 MHz) and all other parameters as described in the “Training database generation” section. More than 99% of the training data set (including distributions with multiple distance peaks) produces the results of the kind shown in the top and middle panels—fast exchange oscillations are rejected and correct distance distributions are produced. With very noisy data (bottom), the networks duly report being highly uncertain.
