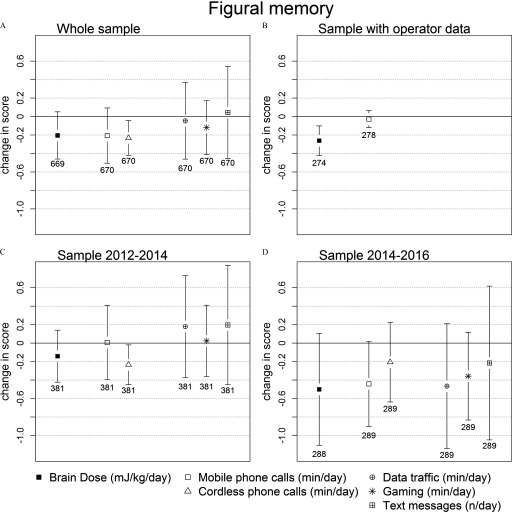
Figure 2.
Results of linear exposure–response models for change in figural memory scores: (follow-up–baseline estimates relate to change in memory score for (A) the whole sample per interquartile range (IQR) of exposure of the whole sample; (B) the operator sample per IQR of operator sample; (C) the sample 2012–2013 per IQR of exposure of the whole sample; and (D) the sample 2014–2015 per IQR of exposure of the whole sample. IQRs of the whole sample: brain dose, ; mobile phone calls, ; cordless phone calls, ; data traffic, ; gaming, ; and text messages, 40 per day. IQRs of the operator data: brain dose, ; and mobile phone calls, . All models were adjusted for age, gender, baseline score, nationality, school level, physical activity, alcohol, and education of parents and change in height and time between baseline and follow-up investigation. Number of observations for each calculation is indicated below each estimate.

