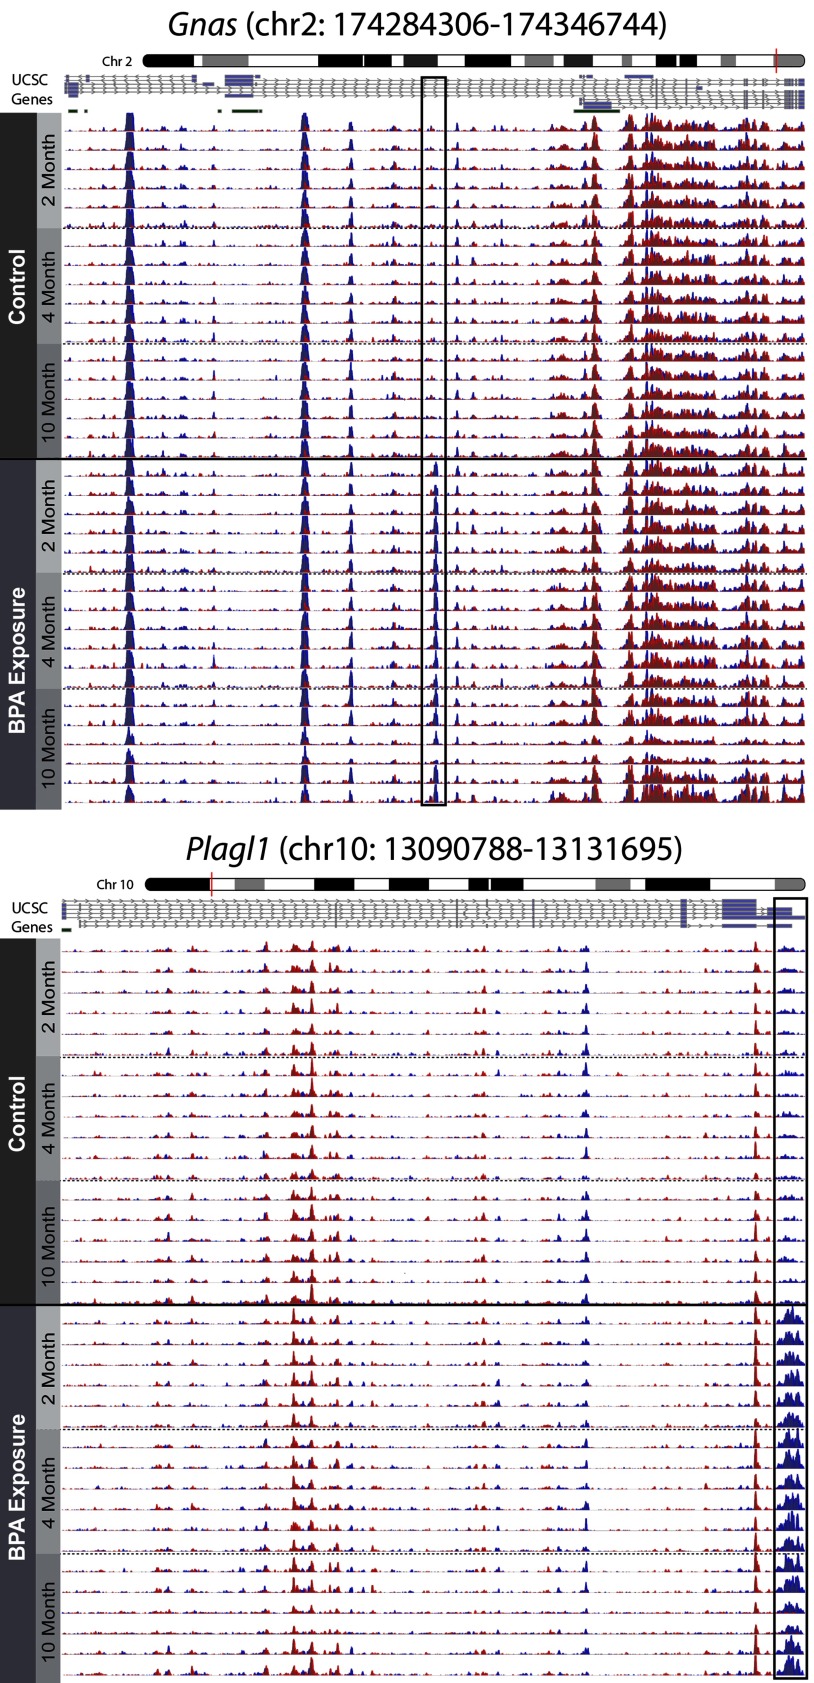
Figure 3.
Genomic context of Gnas and Plagl1 DHMRs. The DHMRs annotated to the Gnas and Plagl1 genes were visualized in the context of their respective imprinted genes using the csaw and Gviz R packages. 5-hmC levels across the complete Gnas and Plagl1 imprinted loci are presented, showing distinct 5-hmC peaks along the length of both genes. 5-hmC levels are shown for matched 2-, 4-, and 10-month blood samples, as indicated by y-axis labels. Boxes indicate significant DHMRs that were identified using csaw differential hydroxymethylation models. Blue and red peaks represent forward and reverse strand 5-hmC enrichment, respectively. Bars below University of California, Santa Cruz genome browser gene tracks represent CpG islands.

