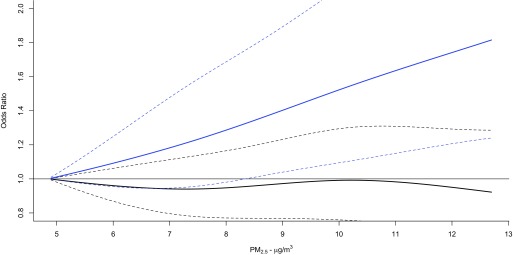
Figure 4.
Concentration–response curves using natural cubic splines with 3 degrees of freedom for the association between exposure to fine particulate matter air pollution with aerodynamic diameter () during the first trimester and term low birth weight, stratified according to below 25th percentile of glutathione-related oxidative potential () (solid line) and above the 75th percentile of (dashed line) in Ontario, Canada (2006–2012). Dotted lines reflect 95% confidence intervals. Models were adjusted for maternal age at delivery, marital status, maternal cigarette smoking during pregnancy, infant sex, parity, previous caesarean section delivery, maternal comorbidities (i.e., asthma, hypertension, type 1 and 2 diabetes mellitus, preeclampsia, and gestational diabetes), year of birth, month of birth, census dissemination-area (DA) median family income, census DA proportion of population who are visible minority, census DA proportion of the adult female population aged 25–64 y old who completed postsecondary education, and gestational age.

