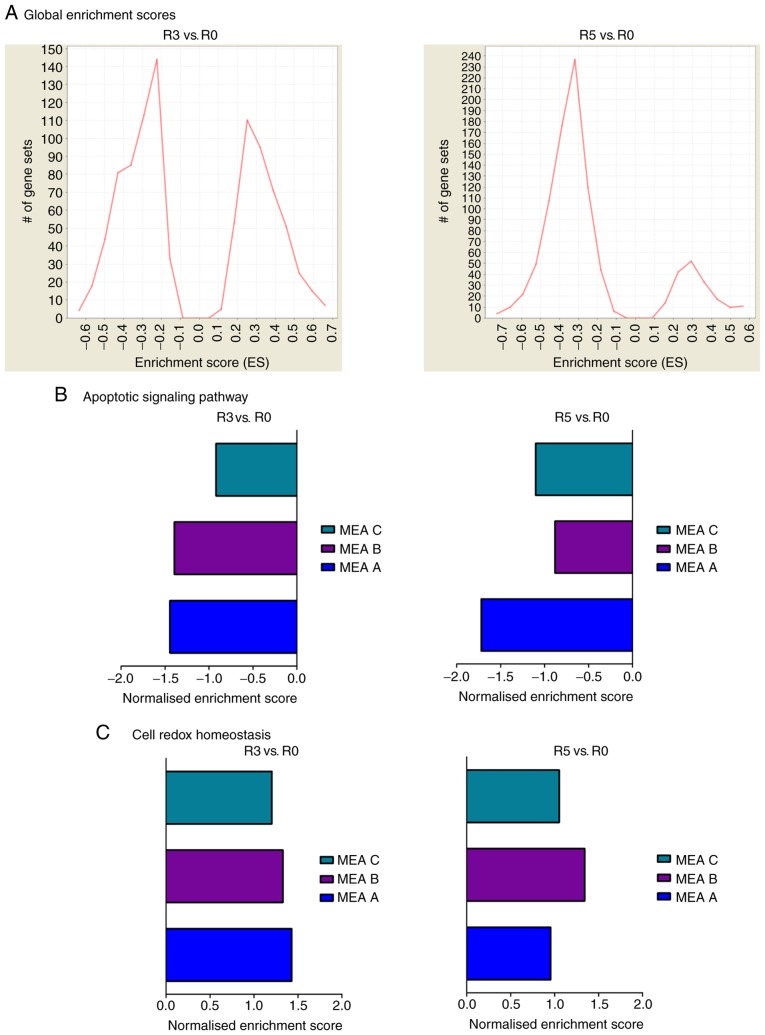
Figure 2.
GSEA. GSEA was performed using gsea2-2.2.3 from the Broad Institute. (A) Global enrichment score histogram. The global enrichment score histograms are depicted to illustrate an overview of the amount of upregulated and downregulated gene sets in all the MEAs, comparing R3 and R5 with R0. (B) Apoptotic signaling pathway. The normalized enrichment score was used to facilitate the comparison of different MEAs. (C) Cell redox homeostasis. The normalized enrichment score was used to facilitate the comparison of different MEAs. GSEA, gene set enrichment analysis; R, round; MEA, Molecular Evolution Assay.

